
Business process mapping is one of many tools used in developing a process based management system. It provides a pictorial representation of a process. In this context, a business process is a series of steps within a specific activity that combine to produce a required outcome. Clearly understanding, defining, and mapping a business process is always the first step down the path of continuous improvement. As a representation of “the way things are done”, process maps are important as a communication tool for providing:
- a platform for educating the steps required to produce a specific result
- a means to collaborate among staff and obtain consensus on how things are done
It is the first or second generation of process documentation that organisations often struggle with, and which is the focus of this article. The goal of the initial creation of a business process map is to benchmark the process for reference and future improvement.
The goal of the initial creation of a business process map is to benchmark the process
How to create a process map
If you’ve never analysed a business process or tried to map a process, then the prospect may be daunting.
- Where to start?
- What are the “right” symbols to use (to represent the various aspects of your process)?
- Do you have to follow a particular format?
As in many areas of business, there are a number of recognised standards that may be used for process mapping. A quick search for business process mapping will uncover information on “flowcharts”, “workflows”, “BPMN”, “swimlane diagrams”, and “process modelling”, to name a few. (Refer to the list of Abbreviations under the Resources menu.)In the first instance, the standard or format that you use to create a process map should be the one that is easiest for you to implement. Follow the principle of keeping it simple. After all, the initial purpose of process mapping is to create the content and communicate the content – capturing individual’s ideas and creating a record of what is known about a process. The medium you use to start creating your process map will often be a large sheet of paper or whiteboard, remembering that you are likely to make multiple changes before you settle on a working version.
The other reason for initially drawing a business process on a whiteboard, is that this an exercise best undertaken by a group, where all team players contribute by brainstorming the steps that make up the process – it is rare that only one person is involved in a given process; involving all stakeholders will facilitate buy-in across the team. Once the content of your process map is agreed upon, then you can transfer it into a drawing package that can be used to create and manage the agreed version and future changes.

Questions, Answers
Q: “What program should I use to draw my business process map?”
A: “Which ever drawing software you have available and are most familiar with.” Often the easiest to use is what you already have available. In many instances, this will be one of the applications from the Microsoft® Office suite – Word, PowerPoint, or Excel. While none of these are specifically just drawing applications, all of these have drawing capabilities as part of their functionality. (If you need to enhance this functionality, you may consider an add-in such as Flowbreeze for Excel by BreezeTree Software.) Open source office software suites have comparable drawing functionality.
Be aware that there are also some good cloud-based (SaaS) solutions emerging. Depending on your organisation, and how your workers interact with resources, these may be viable considerations. One which we have found to be particularly effective is Miro.
As process documentation matures within an organisation, the additional features of applications such as Microsoft® Visio can be beneficial. The advantages of applications such as Visio for drawing business processes, is the capacity to define specific meta data that sits behind each object in your process map. Such data effectively becomes a database of information that complements your process map. The point at which this becomes beneficial will depend on the complexity of the processes and the number of stakeholders involved (or size of the organisation).
Q: “Should I map my process from left to right, or top to bottom?”
A: “It makes no difference. The specific process itself may dictate that it is easier to format in one orientation than another.”
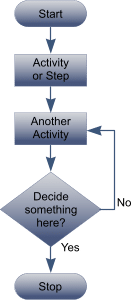
In developing a process map, remember that it is as much about identifying the steps that exist within a process as it is about identifying the order in which the steps occur. The orientation or layout is secondary to the steps and their order.
A business process map should be considered as a dynamic diagram – it is not set in concrete; it changes over time as people, processes, and technologies change. Ideally, the validity of process maps should be regularly tested and adjusted where required.
How does process mapping improve my business?

By documenting your process(es) through process mapping, you are creating a benchmark to work from and improve upon. Quite often, the very act of brainstorming your business process among the relevant team members and stakeholders, will raise questions, improve collaboration, and uncover improvements. Depending on how well established a process is (its level of maturity), and whether or not there are any recent changes that impact on the process, there can be benefits in mapping out an initial process, then re-drawing it to represent the way that it needs to be. This is sometimes referred to as drawing both the “as-is” state and the “to-be”, or “future” state.
Once you’ve completed an initial process map, ask whether there are steps that are redundant or steps that can be rearranged to improve efficiency.
The important aspect here is to provide a basis for ongoing, continuous improvement. Something that can be refined over time, as and when influencing factors change. Factors that can impact on your now documented process map(s) include:
- market changes
- legislation or regulation changes
- organisation structural changes
- changes in available resources
- etc
Draw on the experience of others
As with many challenges, trying to find solutions by yourself is not always the best strategy. This is definitely the case when it comes to business process mapping. It can often be that business process improvements are more readily identified through a fresh set of eyes, by someone who is impartial to the situation.
This is where an experienced business process improvement consultant can provide significant value. The short term cost can lead to significant long term gains.
If you have a specific Business Process Mapping project requirement that you feel we may be able to assist you with, either now or in the near future, then tell us about your project here. We love helping others solve the challenges of business process mapping and process improvement.
Further reading: Business Process Improvement
(Microsoft, Excel, Word, PowerPoint and Visio are either registered trademarks or trademarks of Microsoft Corporation in the United States and/or other countries.)
